
Understanding and monitoring key performance indicators (KPIs) and metrics can make the difference between flourishing success and unforeseen challenges. In this blog post, we’ll explore what metrics and KPIs are, delve into specific restaurant metrics, and guide you on defining the right metrics for your restaurant business.
Metrics are quantifiable measurements used to track and assess various aspects of a business. In the restaurant industry, these metrics provide valuable insights into performance, allowing for informed decision-making.
KPIs are specific metrics that align with business goals and objectives. They serve as benchmarks for success and help gauge the effectiveness of strategies and operations.
Restaurant metrics encompass a broad range of data points that offer insights into the overall health and performance of your establishment. From financial metrics to customer satisfaction indicators, these metrics provide a comprehensive view of your restaurant’s operations.
Efficient management of food costs is crucial for profitability. Track the percentage of revenue spent on ingredients to optimize menu pricing and control expenses.
(Cost of Goods Sold / Total Revenue) x 100
Keeping labor costs in check is essential for maintaining healthy profit margins. Monitor the percentage of total revenue allocated to labor to ensure efficient staffing and cost management.
(Total Labor Costs / Total Revenue) x 100
A high turnover rate indicates efficient service and increased revenue potential. Measure the percentage of tables turned to optimize seating and enhance overall dining experience.
(Number of Tables Turned / Number of Available Tables) x 100
Satisfied customers are more likely to become repeat patrons and brand advocates. Calculate the percentage of satisfied customers to gauge the success of your service and offerings.
(Number of Satisfied Customers / Total Customers) x 100
Understanding average spending per customer aids in strategic pricing and upselling. Monitor the average revenue generated per customer to optimize menu items and promotions.
Total Revenue / Number of Customers

Efficient inventory turnover prevents waste and ensures fresh ingredients. Calculate the ratio of cost of goods sold to average inventory for insights into inventory management.
Cost of Goods Sold / Average Inventory
Minimizing no-shows maximizes seating efficiency and revenue. Track the percentage of reservations that result in no-shows to implement strategies for reducing this occurrence.
Number of No-shows / Total Reservations) x 100
Prime cost reflects the total cost of goods and labor, a key indicator of overall efficiency. Monitor the sum of cost of goods sold and total labor costs to assess and optimize operational expenses.
Cost of Goods Sold + Total Labor Costs
A high gross profit margin is essential for sustaining business operations. Calculate the percentage of revenue retained after deducting the cost of goods sold to ensure healthy profitability.
((Total Revenue – Cost of Goods Sold) / Total Revenue) x 100

Assessing ROI helps in evaluating the profitability of various investments. Monitor the return on investment percentage to make informed decisions about new ventures and initiatives.
((Net Profit / Cost of Investment) x 100
Active social media engagement enhances brand visibility and customer loyalty. Measure the engagement rate by calculating the total likes, comments, and shares divided by the number of posts.
(Likes + Comments + Shares) / Number of Posts
Positive online reviews contribute to the overall reputation and trustworthiness of your restaurant. Calculate the percentage of positive reviews to assess and enhance your online presence.
(Positive Reviews / Total Reviews) x 100
Reducing waste percentage improves cost-efficiency and environmental sustainability. Monitor the percentage of wasted food value in relation to total revenue to implement effective waste reduction strategies.
(Value of Wasted Food / Total Revenue) x 100
A content workforce leads to better customer service and overall restaurant performance. Calculate the percentage of satisfied employees to gauge and improve workplace satisfaction.
(Satisfied Employees / Total Employees) x 100
Optimizing reservation conversion enhances table utilization and revenue generation. Track the percentage of confirmed reservations to assess the effectiveness of your reservation management system.
(Number of Confirmed Reservations / Total Reservations) x 100
Selecting the right metrics depends on your specific business goals and operational focus. Consider the unique aspects of your restaurant and tailor your metrics to align with strategic objectives. It’s crucial to strike a balance between financial metrics, customer satisfaction indicators, and operational efficiency measures.
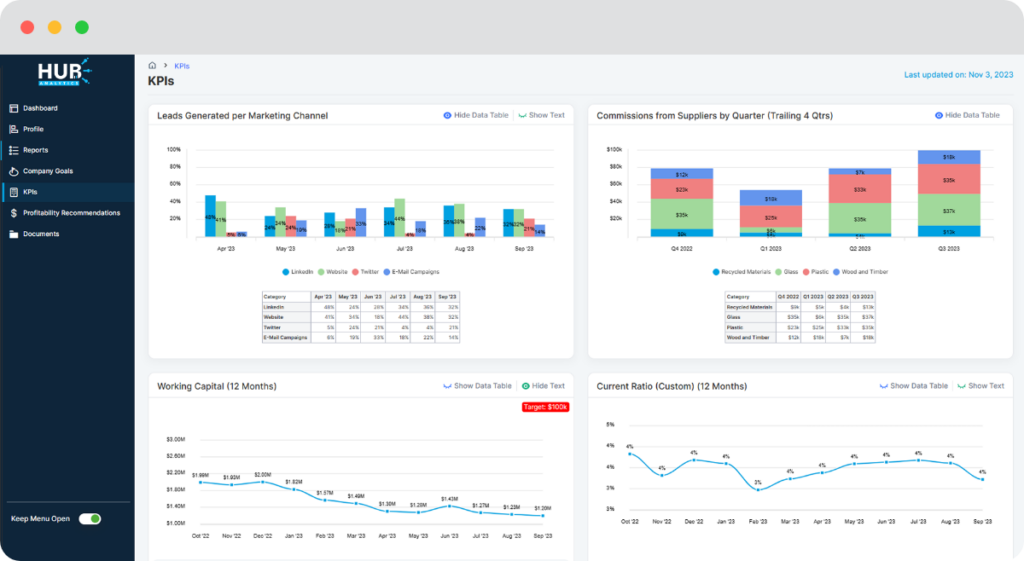
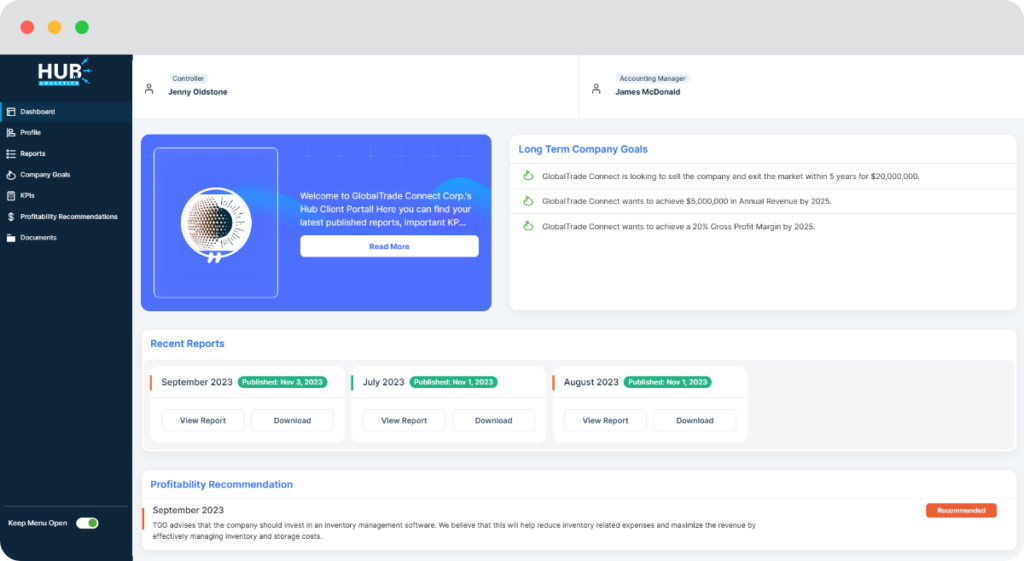
To streamline the process of tracking and analyzing restaurant metrics, consider utilizing dedicated software solutions like HUB. These platforms offer comprehensive tools for monitoring key restaurant metrics, providing real-time data, and facilitating data-driven decision-making.