
Advisors, consultants, and investors need to delve into the realm of financial metrics to make informed decisions. This blog post explores the crucial aspects of financial metrics and offers insights into the top 15 metrics that should be on every professional’s radar.
Understanding the basics: Metrics and Key Performance Indicators (KPIs) are the lifeblood of effective decision-making. Before we dive into the financial world, let’s clarify these foundational concepts.
Delving into the financial realm: Financial metrics are quantifiable measures used to assess and analyze various aspects of an organization’s financial performance. From revenue growth to profitability, these metrics provide a comprehensive view of a business’s fiscal health.
Monitor the percentage increase in your company’s revenue over a specified period, revealing the effectiveness of your sales and marketing strategies. A positive growth rate indicates business expansion, while a negative rate may signal challenges.
Revenue Growth Rate=(Current Revenue – Previous Revenue)/Previous Revenue×10
Assess the profitability of your business by calculating the percentage of profit earned from total revenue, providing insights into cost management and operational efficiency. A higher net profit margin indicates better financial health.
Net Profit Margin=Net Profit/Total Revenue×100
Evaluate the return generated on investments, showcasing the efficiency of capital utilization and the profitability of various initiatives. A higher ROI indicates better returns relative to the investment cost.
ROI=Net Gain from Investment/Cost of Investment×100
Track the movement of cash in and out of your business, ensuring liquidity and uncovering potential challenges in meeting financial obligations. Positive cash flow is essential for sustainability.
Cash Flow=Cash Inflows−Cash Outflows
Gauge the balance between debt and equity in your capital structure, indicating financial leverage and risk exposure. A higher ratio may signify higher risk.
Debt-to-Equity Ratio=Total Debt/Total Equity

Determine the profitability of core business operations by measuring the percentage of operating income relative to revenue. A higher margin indicates efficient cost control.
Operating Profit Margin=Operating Profit/Total Revenue×100
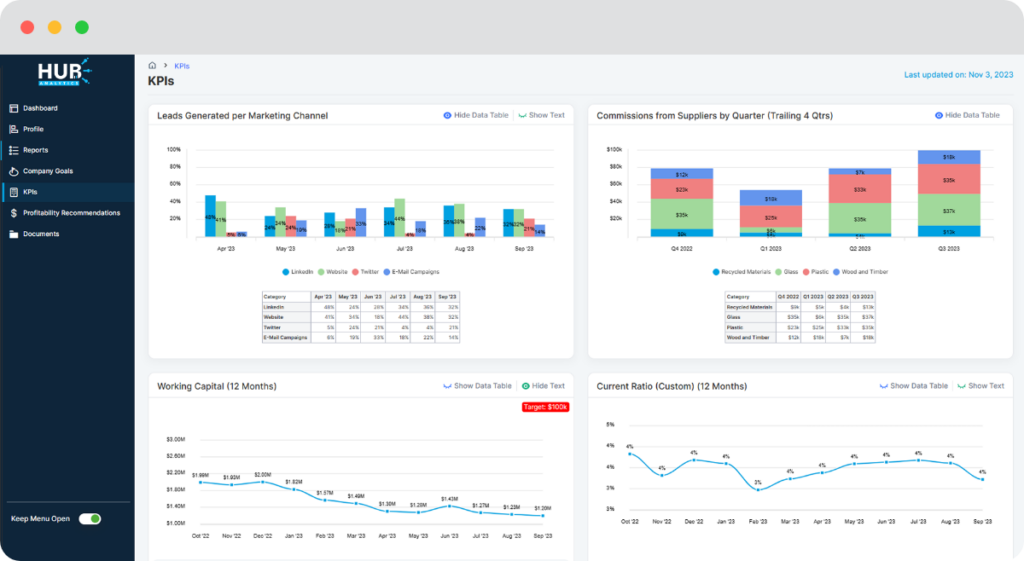
Assess your company’s short-term liquidity and ability to cover immediate liabilities by comparing current assets to current liabilities. A ratio above 1 indicates a healthy financial position.
Current Ratio=Current Assets/Current Liabilities
Calculate the cost associated with acquiring a new customer, aiding in the evaluation of marketing and sales efficiency. Lower CAC is favorable.
CAC=Total Marketing and Sales Costs/Number of New Customers Acquired
Determine the total revenue a customer is expected to generate over their entire relationship with your business, guiding customer acquisition and retention strategies. A higher LTV justifies higher acquisition costs.
LTV=Average Purchase Value×Purchase Frequency×Customer Lifespan

Measure the rate at which your company is consuming cash, crucial for budgeting and financial sustainability. A negative burn rate is ideal, indicating sustainable operations.
Burn Rate=Change in Cash Balance/Time Period
Analyze the percentage of revenue retained after deducting the cost of goods sold, providing insights into product/service profitability. A higher margin indicates effective production and pricing strategies.
Gross Profit Margin=(Revenue – Cost of Goods Sold)/Revenue×100
Evaluate short-term liquidity by considering only the most liquid assets in relation to current liabilities, excluding inventory. A ratio above 1 indicates the ability to cover short-term obligations.
Quick Ratio=(Current Assets – Inventory)/Current Liabilities
Assess operational profitability by excluding interest and taxes, providing a clearer picture of core business performance. EBIT is a key metric for understanding a company’s operating performance.
EBIT=Revenue−Operating Expenses
Determine the capital available for day-to-day operations by subtracting current liabilities from current assets. Positive working capital ensures smooth business operations.
Working Capital=Current Assets−Current Liabilities
Measure the efficiency of asset utilization in generating profits, offering insights into overall operational effectiveness. A higher ROA indicates better asset management.
ROA=Net Income/Total Assets
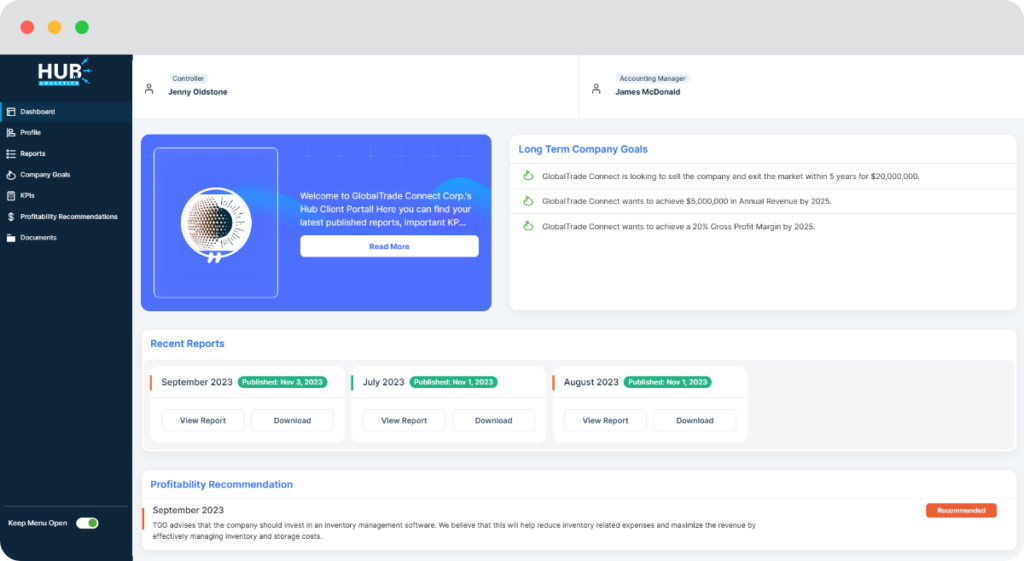
Tailoring metrics to your needs: Every business is unique. Discover the process of selecting and customizing financial metrics that align with your specific goals and industry requirements. Whether you’re a financial advisor, consultant, or investor, this section provides actionable insights to refine your approach.
Ready to elevate your financial game? Start tracking essential metrics with HUB today. Optimize performance, gain valuable insights, and make informed decisions for lasting success. Your financial journey begins here.